Hi #SmartCommunity friends. Welcome back to this very special series here on the Smart Community Podcast, all about data storytelling, As part of my PhD research, I’m speaking with experts from all over the world who are using data visualisations and storytelling in real world projects to support decision making and advocacy.
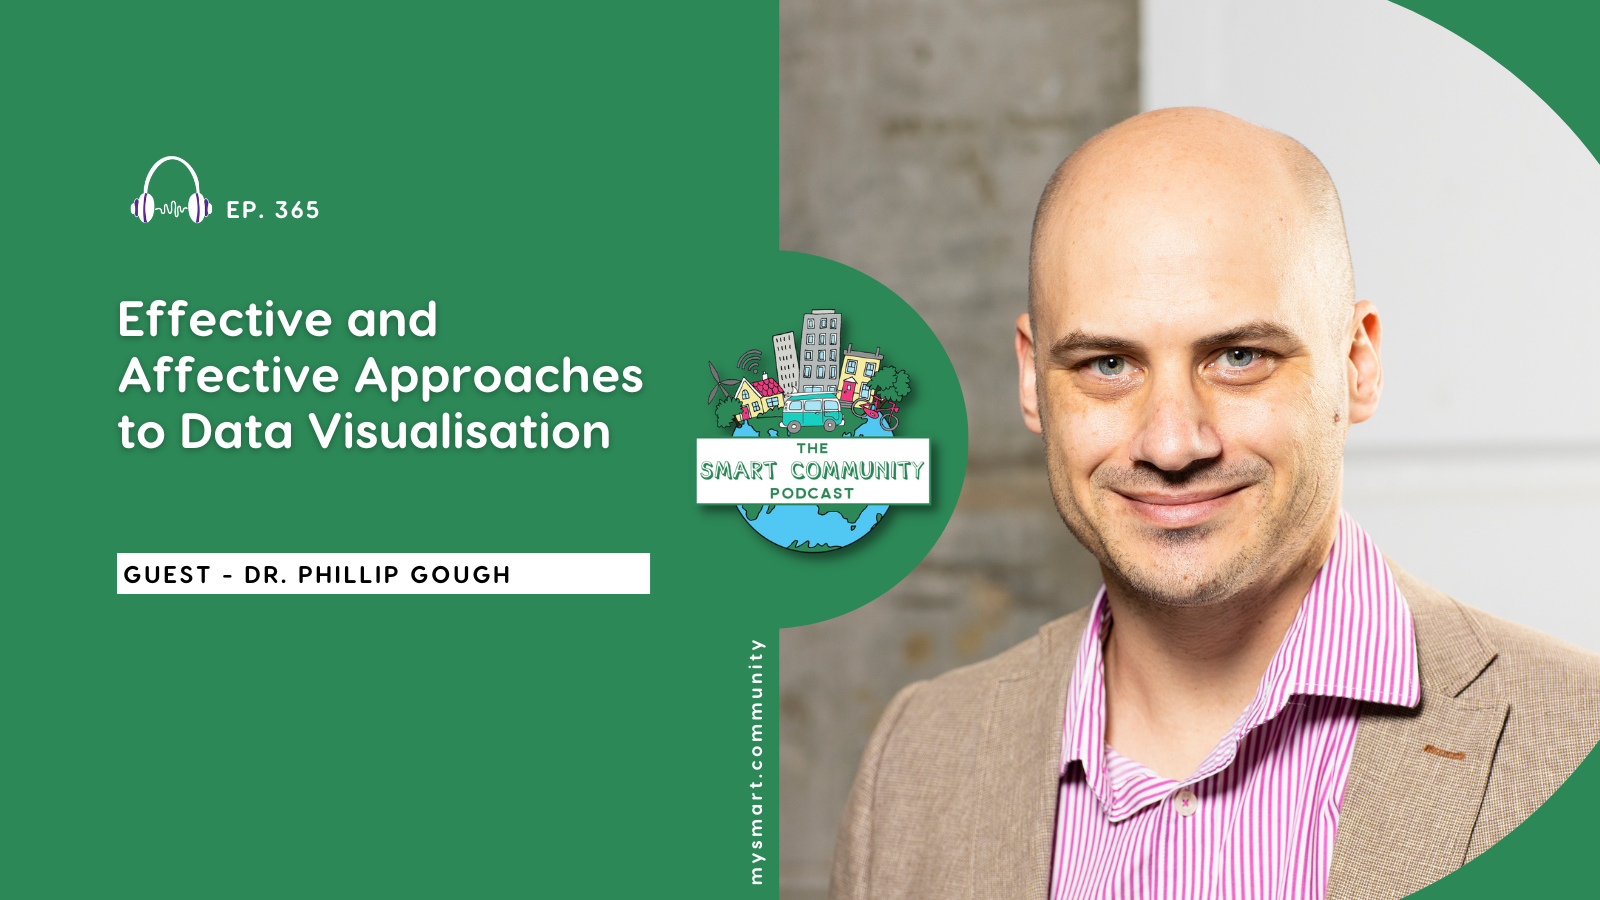
In this episode of the Smart Community podcast I have a fantastic chat with Dr Phillip Gough. Phillip is a senior lecturer at the University of Sydney in the School of Architecture Design and Planning, specialising in human-centred design and interaction design. As a designer and researcher, he focuses on building and evaluating interactive systems, with particular expertise in biomaterials for a sustainable circular economy.
In this episode Phillip tells us about his work with clinicians at Westmead Hospital developing decision support tools for emergency department triage, and his collaboration with agricultural companies using satellite data to optimise cattle movement across Australia. Phillip and I discuss the importance of understanding user workflows, the difference between effective or functional and affective or emotional data visualisation and the challenges of working within existing technical constraints such as the software or platforms available to a particular organisation or situation.
We talk about the way data visualisations can be both playful or creative, and purposeful and meaningful, plus the way data can be art, or the concept of data physicalisation. We finish our chat discussing Phillip’s perspective on making invisible information visible through visualisation and his advice for exploring personal data through creative practice. As always, we hope you enjoy listening to this episode as much as we enjoyed making it.
What we cover in this episode:
- Dr Phillip Gough’s background in human-centred design and interaction design at the University of Sydney
- His research into biomaterials as sustainable alternatives to plastic technology components
- A case study of developing AI-powered sepsis detection tools for emergency department nurses at Westmead Hospital
- The design challenge of translating computer science risk models into language that clinicians understand and can act upon
- The importance of observing actual user workflows rather than making assumptions about how systems will be used
- Technical constraints when working within existing health system platforms like Tableau versus custom web applications
- Heuristic evaluation methods specifically designed for information dashboards in healthcare settings
- The distinction between effective (functional) and affective (emotional) data visualisation approaches
- Examples of creative data visualisation including “If the Moon Were Only One Pixel” and work by Periscopic on gun violence
- Data physicalisation projects using materials like yarn and nails to create interactive parallel coordinate plots
- Agricultural data visualisation projects using satellite imagery to optimise cattle movement and supply chain decisions
- The concept of making “invisible” information visible through thoughtful data visualisation design
- Exploring personal data as a creative visualisation practice
Quotes:
“How do we translate this kind of computer science, what they call a risk stratified list of the patients in the ED… into language that the actual nurses understand and can make a decision based on that?”
“I think it’s important that is not just effective… it should also be affective. So effective and affective. So it should have some kind of connection to people.”
“No data visualisation is neutral. There is no such thing. Whoever’s designed it has put some perspective on it, and that’s not necessarily a bad thing.”
“To make something that’s impactful means that I’m able to provide something that is invisible to them… can visualisation highlight something in a way that is otherwise almost inaccessible?”
“Think about just starting to explore the data that is out there, but not necessarily important to show anyone… those other things, I think they’re just as important to be mindful of and visualisation’s a fascinating way of approaching that.”
Links:
“If the Moon Were Only One Pixel” by Josh Worth
Periscope gun violence data visualisation
Connect:
Connect with Dr. Phillip Gough on LinkedIn or via University of Sydney.
Connect with me via email: hello@mysmart.community
Connect with My Smart Community via LinkedIn and watch on YouTube
Podcast Production by Perk Digital
This podcast is recorded on Yugarabul country and edited on Gaibal country. I pay my respects to traditional owners of country and their elders past and present. I also extend that respect to all Aboriginal and Torres Strait Islander peoples listening today. Here on the Smart Community Podcast, we talk about data, technology, communities and the future. First Nations peoples have been sharing knowledge, caring for country, and telling stories for tens of thousands of years. I honour that deep connection of storytelling and community connection as we continue our conversation together here today.
Disclaimer
The views, opinions, and perspectives expressed by guests on The Smart Community Podcast are solely those of the individual speakers. They do not necessarily reflect the views, opinions, or positions of the host, Zoe Eather, or of The Smart Community Podcast as a whole.
Any discussion of ideas, products, organisations, or services by podcast guests does not constitute endorsement or recommendation by the host or the podcast. Listeners are encouraged to form their own opinions and seek professional advice where appropriate.